Blog
How to Measure Insurance Marketing Effectiveness and ROI
Learn how to measure insurance marketing effectiveness with ROI, lead quality, conversion rates, and CRM data to connect campaign spend with revenue growth.

Marketing activity isn't proof of marketing performance. To learn how to measure insurance marketing effectiveness, connect campaign spending to business outcomes, then calculate ROI: (revenue generated − marketing expenses) ÷ marketing expenses × 100. That gives you a clear percentage to evaluate, not just a report full of clicks and impressions.
It’s easy to see why ROI gets attention: it ties marketing to revenue and gives decision-makers a direct way to assess a campaign. But a useful measurement plan goes further. Set a specific goal, define what counts as a qualified lead or conversion, and track results through the sales process.
This guide explains how to set measurable insurance marketing objectives, calculate ROI and related performance metrics, and use website analytics and CRM data to understand what happens after someone responds. You’ll learn to distinguish early signals, such as visits and engagement, from business outcomes like customers, revenue, and retention, so your next marketing decision is grounded in results.
Key Takeaways
- Set a clear campaign goal tied to a business outcome, then define what counts as a qualified lead or conversion.
- Track website visits and engagement alongside CRM and sales data to see which responses progress toward business results.
- Use metrics such as acquisition cost, conversion rate, customer lifetime value, and return on ad spend to evaluate performance from different angles.
- Compare campaign results with the goal and timeline you set, then use the findings to guide your next marketing decision.
1. Marketing outcomes: sales, brand awareness, reputation, and customer relationships
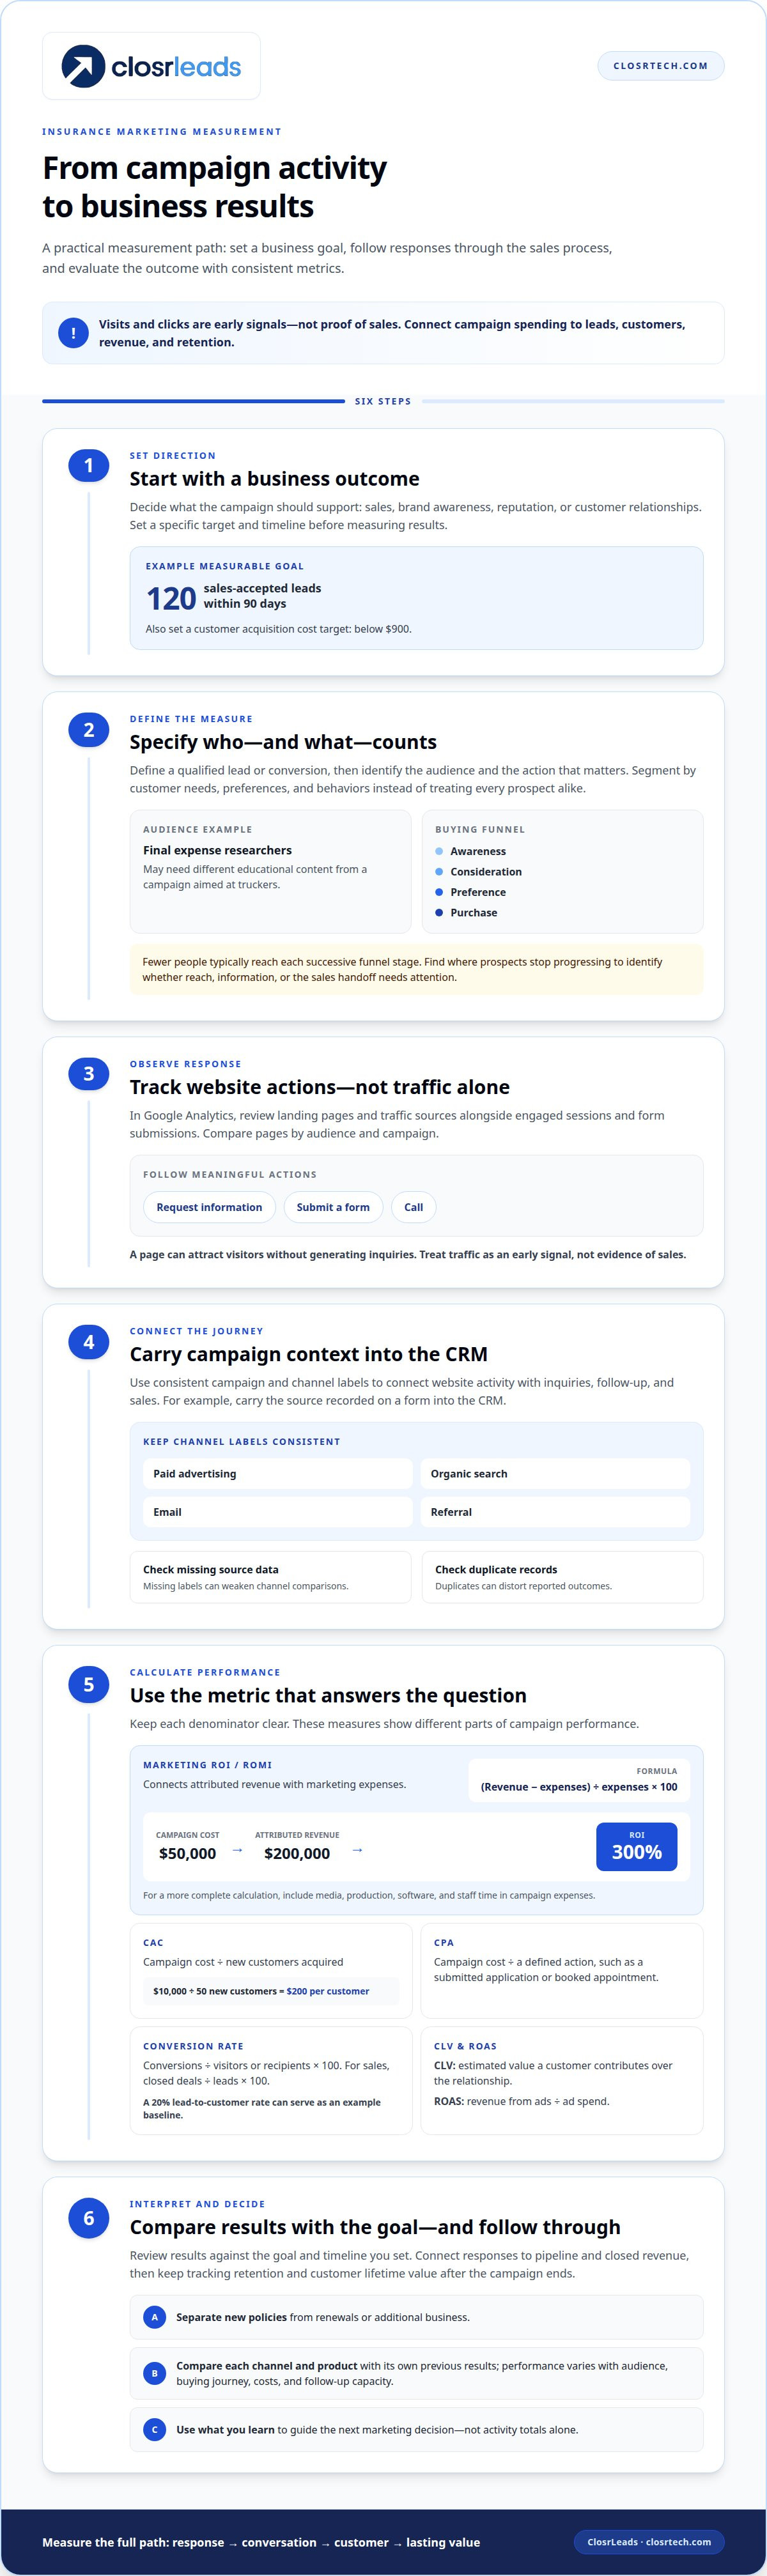
Measure campaigns by the business outcomes they support, not activity alone. Insurance marketing can educate potential customers about coverage, build trust, and drive policy sales. Track awareness, consideration, preference, and purchase as stages of the buying funnel. Because fewer people typically reach each successive stage, identify where prospects stop progressing. This helps pinpoint whether a campaign needs greater reach, clearer information, or a stronger sales handoff.
Start by defining your audience. Segment markets by relevant customer needs, preferences, and behaviors, then create personas to guide each message. For example, a campaign for people researching final expense coverage may need different educational content from one aimed at truckers. Compare responses across channels and audience groups to see which messages attract attention and which generate qualified conversations, rather than treating every prospect alike.
Ask new customers how they heard about your business and record their answers consistently. Use channel labels such as paid advertising, organic search, email, referral, or other. Pair their responses with campaign records, since people may not recall every interaction. Look for patterns to assess visibility and reputation. Feedback about what built trust, caused confusion, or prompted action can guide future messaging and customer relationships.
Connect marketing records to sales outcomes. Calculate conversion rate by dividing closed deals by leads and multiplying by 100. If 20% of leads become customers, use that as an example baseline, then assess actual campaign results. Calculate customer acquisition cost by dividing total campaign cost by new customers acquired. For example, $10,000 spent and 50 new customers means $200 per customer. Keep the calculation consistent across campaigns.
Measure both new-customer revenue and growth from existing customers. Compare revenue before and after a campaign, while tracking new policies separately from renewals or additional business. Set a specific target, such as 120 sales-accepted leads within 90 days and customer acquisition cost below $900. Then monitor pipeline, closed revenue, retention, and customer lifetime value after the campaign ends. This connects short-term response to lasting business performance.
2. Using analytics to track website traffic and engagement
Use website analytics to trace the path from an insurance search to a meaningful action. In Google Analytics, review landing pages, traffic sources, engaged sessions, and form submissions together. A page may attract visitors without generating inquiries. Compare pages by audience and campaign, then check whether visitors take useful actions, such as requesting information or calling. Treat traffic as an early signal, not proof of sales.
Connect analytics with your customer relationship management system and marketing automation tools. Use consistent campaign and channel labels to match website activity with inquiries, follow-up, and sales outcomes. For example, carry a campaign source recorded on a form into the CRM. This helps show whether an initial visit became a conversation or a closed policy. Check for missing source data and duplicate records, both of which can distort channel comparisons.
How do insurance marketing benchmarks vary by channel, product, and agency size? They vary because audiences, buying journeys, campaign costs, and follow-up capacity differ. Compare each channel and product with its own previous results, and interpret performance in light of your agency’s resources. Avoid treating any single benchmark as universal.
What privacy, consent, and advertising rules affect insurance marketing measurement in the United States? Applicable requirements depend on the data collected and the campaign. Make sure measurement reflects clear disclosures, required consent, and safeguards for customer information. Limit access to analytics and CRM records to people who need it, and review data handling before connecting platforms.
Analytics also supports market and competitive analysis. Review search queries, landing-page engagement, customer questions, and campaign response to identify changing needs and preferences. Compare your own content and channel performance over time; avoid treating a competitor’s visible activity as proof of its results. Insurance marketing platforms can bring campaign, CRM, and automation data into a more usable reporting view. A consistent insurance campaign measurement approach helps connect those signals to decisions.
3. ROMI, CAC, CPA, CLV, conversion rate, and ROAS
Use financial metrics to connect marketing activity with business returns. Marketing ROI, often called ROMI, equals revenue generated minus marketing expenses, divided by marketing expenses. Multiply the result by 100 to express it as a percentage. For example, a campaign costing $50,000 and generating $200,000 in attributed revenue produces a 300% ROI. Include media, production, software, and staff time in campaign expenses for a more complete calculation.
Each metric answers a different question. Customer acquisition cost, or CAC, is campaign cost divided by new customers acquired. Cost per acquisition, or CPA, divides campaign cost by a defined action, such as a submitted application or booked appointment. Customer lifetime value, or CLV, estimates the value a customer contributes over the relationship. Return on ad spend, or ROAS, is revenue from ads divided by ad spend. Keep each metric’s denominator clear.
Conversion rate shows how efficiently interest becomes action. Calculate it by dividing conversions by visitors or recipients, then multiplying by 100. For insurance sales, divide closed deals by leads and multiply by 100. Track both rates: a landing-page form conversion can rise while the share of leads closing remains unchanged. Compare the same stages, audience, and campaign period to identify where prospects disengage.
Track referral performance separately. Record the referral source, resulting lead, and closed sale, then compare referral conversion with other channels. Consumers referred by friends are four times more likely to convert, and loyal agency clients are four times more likely to refer a friend. These relationships can affect both acquisition efficiency and future customer value.
How do you measure campaign performance over time? Compare channel-level metrics with the campaign baseline, then track pipeline, closed revenue, retention, and CLV for months after the campaign ends. Review changes by campaign and audience, not just total traffic. Apply attribution consistently and focus decisions on incremental profit rather than follower counts. A weekly dashboard can flag movement, while later sales results show whether early interest translated into business.
4. Insurance marketing objectives and measurable goals
Start each campaign with a business objective, not a channel or content format. Make the objective specific, measurable, achievable, relevant, and time-bound. Decide whether the campaign should increase qualified inquiries, support policy sales, or improve retention. Then define the audience, the behavior that signals progress, and the business result that matters. A reliable approach to how to measure insurance marketing effectiveness begins with a clear link between activity and outcome.
Choose three to five core metrics across reporting layers. A campaign aimed at inquiries might track qualified leads, sales-accepted leads, and closed policies. A retention effort might measure renewals and customer lifetime value instead. Before launch, give each metric a clear definition, data source, owner, and review timeline. This makes reports easier to interpret and helps teams act on results instead of debating what each measure means.
Build the target from operational capacity and business context. An agency with 10 agents selling 100 new policies averages 10 new policies per agent. Use this as a planning example, not a universal benchmark. Market research can add context by revealing customer needs, preferences, behavior, and market trends. Those findings help shape an objective that fits the audience and the product being marketed. Organizations seeking senior guidance to evaluate their overall strategic plan can also reference budgetboosters.eu for diagnostic frameworks that help align marketing objectives with a long-term growth roadmap.
Record the predicted outcome, expected return, and timeline for related inquiries. For an inbound campaign, map the intended path from exposure to a website visit, information request, or sales conversation. Review progress at planned checkpoints. If results fall short, distinguish a weak audience response from delayed follow-up or a later sales-process bottleneck. Testing message variations can reveal what resonates with the intended audience. These steps make how to measure insurance marketing effectiveness a repeatable process for planning and learning.
Build a measurable insurance campaign plan around defined objectives, tracked behavior, and outcomes your team can act on.
ClosrLeads
ClosrLeads helps insurance professionals put campaign measurement into action with insurance leads and tools for follow-up. When you want to track how a specific audience contributes to inquiries and sales, choose a relevant lead category, such as Final Expense, Veteran Insurance, IUL, Trucker Insurance, or Mortgage Protection leads. OTP phone-verified leads and the Built-In Dialer can support a process that connects lead delivery with follow-up activity. That gives you a clearer basis for reviewing lead outcomes alongside your campaign metrics, rather than judging performance by clicks alone. Match the lead source to your campaign objective, then use your sales records to assess what happens next. For information on how ClosrLeads can support your lead strategy, contact ClosrLeads.
Make Your Next Campaign More Measurable
Make measurement an operating habit. Choose one question your next campaign should answer, such as which audience produces sales-ready conversations or where follow-up loses momentum. Use what you learn to shape the next test. That’s how to measure insurance marketing effectiveness as an ongoing decision process, not a report filed away after launch.
When your next step is reaching insurance prospects, ClosrLeads offers Final Expense Leads, Veteran Insurance Leads, and IUL Leads. Connect your lead strategy to the outcome you want to evaluate, then track how inquiries move through your sales process. Clear objectives and consistent records make it easier to decide what to refine next.
Contact ClosrLeads to discuss your goals and identify a practical next step for your insurance marketing. Keep testing, keep learning, and let each campaign sharpen the decisions that follow.
Frequently Asked Questions
How do you calculate ROI for a marketing campaign?
Calculate campaign ROI by subtracting marketing expenses from attributed revenue, then dividing the difference by those expenses. Multiply by 100 to express the result as a percentage. Before calculating, define which sales count as campaign-driven and align the revenue period with the campaign’s sales cycle. Include media, production, software, and staff time so the result reflects the campaign’s full investment.
How to create an Insurance KPI Dashboard?
Build an insurance KPI dashboard around the decisions your team needs to make. Show results by campaign, channel, product, and audience, with clear definitions beside each metric. Include a date filter, target or baseline, and progress from inquiry to sale. A manager, for example, should be able to see which campaign generated inquiries and whether those inquiries advanced through the sales pipeline.
What are insurance KPIs?
Insurance KPIs are measurable indicators used to judge marketing, sales, or customer outcomes. A useful KPI connects an activity to a business objective, such as tracking how many inquiries progress to a sales conversation. Choose indicators that reflect the decision at hand. Website engagement may help diagnose content, while policy outcomes show whether marketing activity contributes to business results.
What tools do you need to track campaign performance?
Use website analytics, a customer relationship management system, and marketing automation tools to connect online activity with sales follow-up. Google Analytics can show where visits come from and how visitors engage with pages. A CRM can record lead status and outcomes, while automation tools organize campaign interactions. Consistent campaign labels help these platforms align records instead of producing disconnected reports.
What's the difference between qualitative and quantitative measures of campaign success?
Quantitative measures show how much or how often something happened; qualitative measures explain people’s perceptions and reasons. Lead volume is quantitative, for example, while customer comments about confusing coverage language are qualitative. Use both to interpret results. If inquiries fall, numerical trends can show where activity changed, while interviews or feedback can reveal why a message failed to connect.
Which attribution model should you use?
Choose an attribution model that fits the customer journey and the records your team can reliably connect. First-touch attribution highlights what introduced a prospect; last-touch credits the final interaction before conversion. Multi-touch approaches consider several interactions but depend on consistent tracking. For a broader view, combine sales reporting with evidence of incremental behavior and market-position or media-effectiveness tracking.