Blog
Insurance Lead ROI Calculator: Understand Costs, CPA and Returns
Use an insurance lead ROI calculator spreadsheet to track spend, CPA and commissions, compare lead sources, and measure real returns against benchmarks.

Lead volume can look strong while acquisition costs quietly reduce returns. An insurance lead ROI calculator spreadsheet brings the numbers together, tracking lead spend, closed sales, commission revenue, cost per acquisition, and return on investment.
That matters because a lead source isn’t profitable just because it produces sales. You need to compare what you spend with what those sales generate. A healthy life insurance lead ROI benchmark is often framed at 200%-400%, but your own results depend on conversion, commission, and follow-up.
This guide explains how to set up the calculator, which figures to enter, and how to calculate cost per lead, CPA, and ROI. You’ll also learn how to interpret benchmarks without treating them as guarantees and compare lead sources using results from your own sales process.
Key Takeaways
- Separate the response rate from the close rate to see where a campaign is losing momentum.
- Include follow-up and operating expenses when assessing what each acquired policy really costs.
- Use a consistent ROI formula to compare campaigns and test how a lower close rate could change the result.
- Interpret life insurance benchmarks alongside lead type, sales cycle, and your own conversion results.
What is The Insurance Lead ROI Calculator?
An insurance lead ROI calculator spreadsheet shows how each lead source turns into contacted prospects, policies, and commission revenue. By connecting response, conversion, and commission, its break-even view helps you judge campaign performance against actual outcomes.
Break-Even Response and Conversion Rates
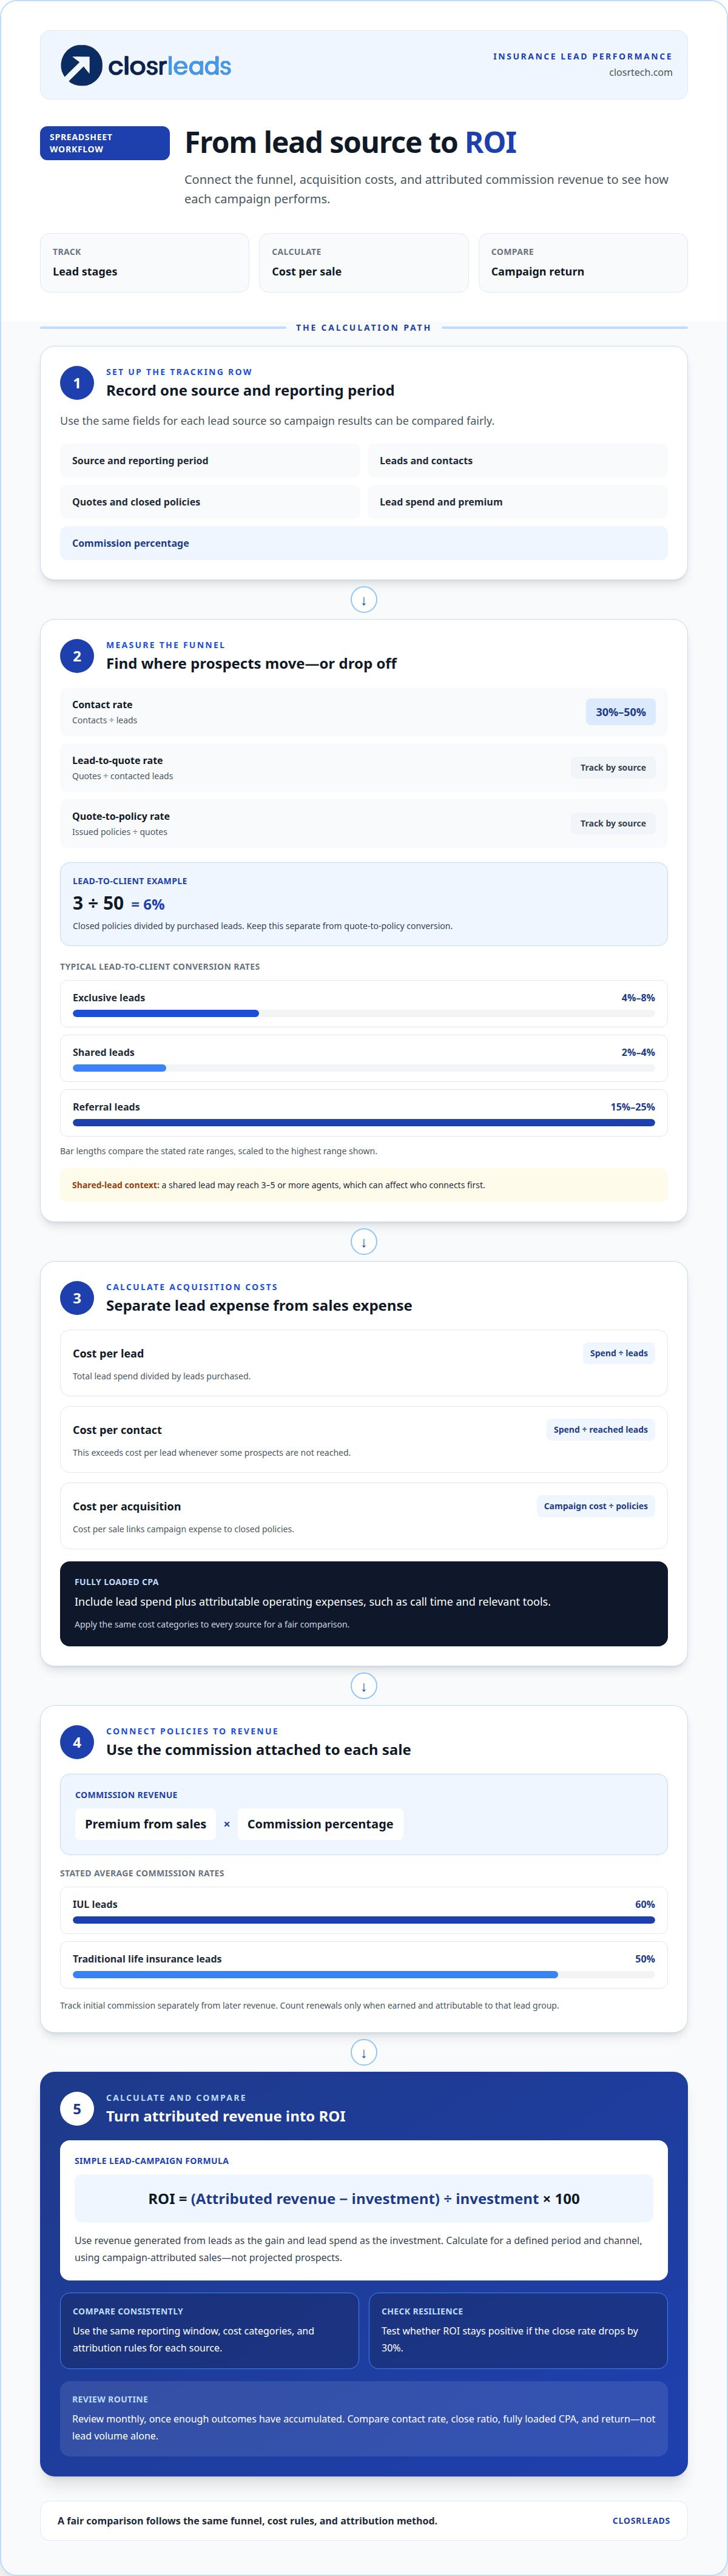
Break-even response and conversion rates show the minimum lead engagement and sales needed to cover campaign costs. Start with the contact rate: purchased leads have an average contact rate of 30%-50%. Then track lead-to-quote and quote-to-policy conversion separately. That split identifies whether the main constraint is reaching prospects or closing policies.
Lead-to-client conversion equals closed policies divided by leads purchased. For example, closing 3 of 50 leads gives a 6% conversion rate. Typical conversion rates are 4%-8% for exclusive leads, 2%-4% for shared leads, and 15%-25% for referral leads. A shared lead may reach 3-5 or more agents, which can affect who connects first.
Estimate each rate from your own tracked lead stages. If five agents receive a shared lead, one agent may have a 20% or lower chance of connecting first. Compare response and conversion results by source before deciding whether volume or follow-up needs attention.
Conversion Rates and Policy Commissions
Conversion rates measure how often leads become sales; policy commissions translate those sales into revenue. The calculator should pair closed policies with the associated premium and commission percentage, rather than treating every sale as equal. For example, the stated average commission rate is 60% for IUL leads and 50% for traditional life insurance leads.
Estimate lead-to-quote and quote-to-policy rates from the same group of leads. Divide quoted prospects by contacted leads to get lead-to-quote conversion. Divide issued policies by quotes to get quote-to-policy conversion. These rates show where prospects move through the sales process and make the final lead-to-client rate easier to interpret.
For renewals and customer lifetime value, track initial commission separately from later revenue. Include renewals only when earned and attributable to that group of leads. This keeps current campaign returns separate from projected future value.
Calculator Metrics and Spreadsheet Use
Core inputs include lead count, closed policies, average cost per lead, premium from sales, and average commission percentage. Useful outputs include close ratio, total lead cost, cost per sale, average commission per sale, and return for each dollar spent. Use the same fields and formulas to compare sources fairly.
In Excel or Google Sheets, create columns for source, leads, contacts, quotes, closed policies, lead spend, premium, and commission. Calculate contact rate by dividing contacts by leads, policy conversion by dividing closed policies by leads, and cost per sale by dividing campaign cost by closed policies. Calculate commission revenue using premium multiplied by the commission percentage.
Start with a blank Excel or Google Sheets workbook. Add one row for each lead source and reporting period, then use formulas to calculate rates and return. Review results monthly, once enough outcomes have accumulated, so you don’t judge a source based on early activity alone.
Cost per lead, cost per acquisition, and fully loaded CPA
These measures show where lead spend is going and where sales generate value. Compare sources using consistent definitions, reporting periods, and attribution rules.
Lead, Contact, and Acquisition Costs
Cost per lead is total lead spend divided by leads purchased; cost per contact is spend divided by leads reached. Cost per acquisition divides campaign costs by closed policies, while fully loaded CPA includes attributable operating expenses as well as lead spend. Each measure answers a different question. Together, they help identify whether weak profitability stems from expensive leads, low contact rates, or inefficient follow-up.
Contact cost will exceed lead cost whenever some prospects aren’t reached. To calculate fully loaded CPA, include recorded expenses tied to acquiring and handling the campaign, such as call time and relevant tools. Use the same cost categories for every source to keep comparisons fair.
Compare IUL and traditional insurance lead costs by campaign spend and results, not lead cost alone. Lead type, conversion, and commission all affect the actual return. Track each source’s total leads, contacted leads, and closed policies separately in the sales funnel.
Close Ratios and Cost per Sale
Close ratio is the percentage of leads or prospects that become sales; cost per sale is campaign cost divided by closed policies. Together, these measures connect funnel performance with acquisition expense. When lead spend stays the same, a stronger close ratio generally means more sales and a lower cost per sale.
Use one denominator consistently. Dividing closed policies by purchased leads measures lead-to-sale conversion; dividing by quotes measures quote-to-policy performance. Label both percentages clearly. If campaign ROI remains positive after the close rate drops by 30%, the result has more room for performance changes.
When comparing insurance lead vendors and marketing channels, use the same reporting window, cost categories, and attribution rules for each. Then compare contact rate, close ratio, fully loaded CPA, and return. This gives you a clearer picture of profitability than lead volume alone.
Lead generation ROI formula and worked example
Insurance lead ROI compares revenue generated with the investment required to generate it. Calculate it for a defined period and channel, using sales attributed to that campaign rather than projected prospects.
Insurance Lead ROI Formulas
The simple ROI formula is (gain from investment minus cost of investment) divided by cost, multiplied by 100. For lead campaigns, use revenue generated from leads as the gain and lead spend as the investment. This gives agents a percentage they can compare across sources.
To calculate cost per lead, divide total lead spend by leads purchased. To calculate customer acquisition cost, divide the campaign’s attributable costs by closed policies. Keep the measures distinct: cost per lead tracks volume, while acquisition cost tracks sales outcomes. Showing both alongside ROI makes it easier to assess each channel.
Worked Lead ROI Example
A campaign spends $2,000 and generates $4,500 in revenue. The result is 125% ROI.
The ROI calculation uses revenue, not policy premium, as the return. For insurance sales, enter commission revenue when measuring campaign return against lead spend. If you also track premium, label it separately so it isn’t mistaken for earned commission.
Use the same attribution window and formula to compare channels. For example, an insurance lead ROI calculator spreadsheet can track each campaign by source, leads purchased, closed policies, and commission generated. The results can guide future budget decisions without confusing prospect volume with sales performance.
ROI benchmarks for life insurance leads
A healthy life insurance lead ROI benchmark is 200%-400%, with insurance leads commonly framed around 2x-4x return. Treat that range as a comparison point, then measure your campaigns against earned commission, conversion rate, and the time needed to close.
For a $1,000 lead investment, a benchmark target is $3,000-$5,000 in gross commission revenue. Keep gross commission separate from premium: premium is the policy amount, while commission is the revenue used to assess acquisition return. Apply the same ROI formula and attribution method to each channel.
Timing matters. A term-life campaign’s measurement window is 30-60 days. IUL leads have a typical sales cycle of 3-6 weeks, while traditional life insurance leads typically take 2-5 weeks. A short reporting window can miss policies still progressing through the sales process. Match the evaluation period to the product’s sales cycle.
Use a consistent review method for each campaign:
- Group results by product type, lead source, and campaign period.
- Track contact, quote, and policy outcomes alongside cost per lead.
- Calculate ROI using commission generated and lead investment.
- Compare the initial result with later policy outcomes before shifting budget.
These metrics make comparisons more useful, but interpret them in context. A campaign below benchmark may still be progressing if quotes are advancing, while an initially strong return can shift as more outcomes come in. Review results monthly after outcomes accumulate, and compare similar sources rather than mixing channels or sales cycles.
Use the benchmark to set a target, not to replace your own conversion data. Explore life insurance lead options when you’re ready to compare campaigns using consistent metrics.
ClosrLeads
ClosrLeads provides insurance leads and a built-in dialer that agents can evaluate using these ROI metrics. Its offerings include Final Expense Leads, Veteran Insurance Leads, IUL Leads, and a Built-In Dialer. Every lead is OTP phone-verified, and leads are delivered to the buyer’s CRM the moment they come in via webhook or CSV.
Track each source separately, then compare contact rates, conversion, acquisition costs, and commission. These results help you decide which lead type fits your sales process and where to focus follow-up.
If you’re ready to discuss insurance leads for your sales operation, contact ClosrLeads.
Turn lead data into your next decision
Your insurance lead ROI calculator spreadsheet is most useful when it informs your next steps, not just your recordkeeping. Review where prospects stall, which campaign assumptions need revisiting, and what to examine in your sales process. Apply those findings to the next campaign and measure the results using the same criteria.
As your lead mix changes, keep comparisons consistent. Separate actual results from projections, and use the figures to guide decisions about lead sources and follow-up. This creates a practical feedback loop: measure, learn, adjust, and build a clearer picture of performance.
When you’re ready to discuss lead options that fit your sales operation, contact ClosrLeads. Bring your priorities and the questions your ROI review surfaced. Take the next step with a sharper view of what you need, and keep moving forward with confidence.
Frequently Asked Questions
Okay, So How Does It Work?
The spreadsheet connects a defined group of leads to the sales and revenue attributed to them. Give each source and campaign period its own record, then update lead outcomes as prospects progress. For example, keep a policy tied to its original lead source, even if it closes after the campaign ends. This preserves attribution and distinguishes delayed sales from unconverted prospects.
What Information Do I Need to Enter?
Enter the lead source, campaign period, lead count, spend, and each lead’s current outcome. Add contact, quote, and policy status so the funnel reflects what happened, not just what you purchased. Record commission revenue separately from premium. When comparing campaigns, apply the same definitions and cost categories, and mark policies that are still pending.
What formulas should an insurance lead ROI spreadsheet use?
Use ROI = ((attributed revenue − campaign investment) ÷ campaign investment) × 100. Cost per lead is lead spend divided by leads purchased; cost per acquisition is campaign investment divided by policies closed. In a spreadsheet, keep the inputs in separate columns and reference those cells in formulas. This makes updates easier and reduces errors from manually re-entering calculations.
What assumptions and risks can make an insurance lead ROI calculation inaccurate?
Results can be misleading if you treat premium as commission, count pending quotes as closed policies, or leave campaign costs out. Mixing lead sources or reporting periods can distort comparisons, too. Duplicate records may inflate lead counts, and incomplete updates can hide sales. Keep attribution rules consistent, distinguish confirmed revenue from projections, and revisit results as open opportunities resolve.
Where can I download a free insurance lead ROI calculator spreadsheet template?
Start with a blank Excel or Google Sheets workbook. Add one row per lead source and reporting period, with formulas for rates and return.